Simple. Beautiful. Intuitive. For serverless developers.

Browse CloudWatch logs for all your application in a single screen.
Search for anything and tail logs in real time. JSON data is nicely formatted and errors are highlighted.
Found the error? Click the line to see all the logs from the same invocation.
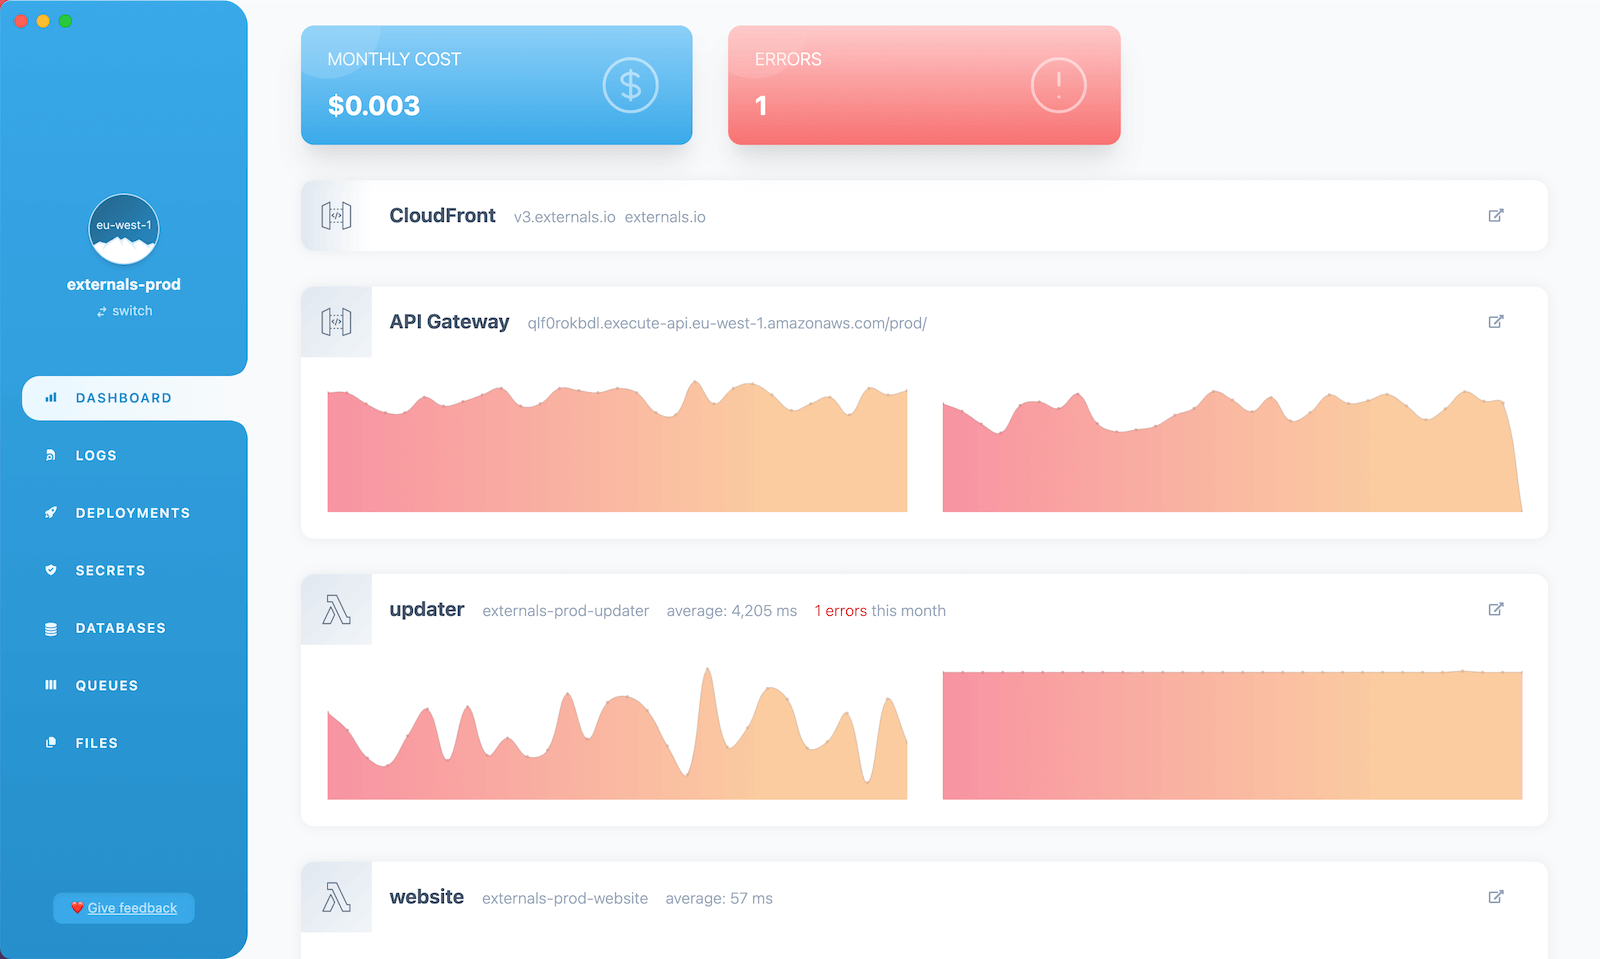
Get an overview of errors, costs, traffic and response time of your application at once.
Focus on a Lambda function and check the metrics that matter: minimum, average, percentiles, cold starts...
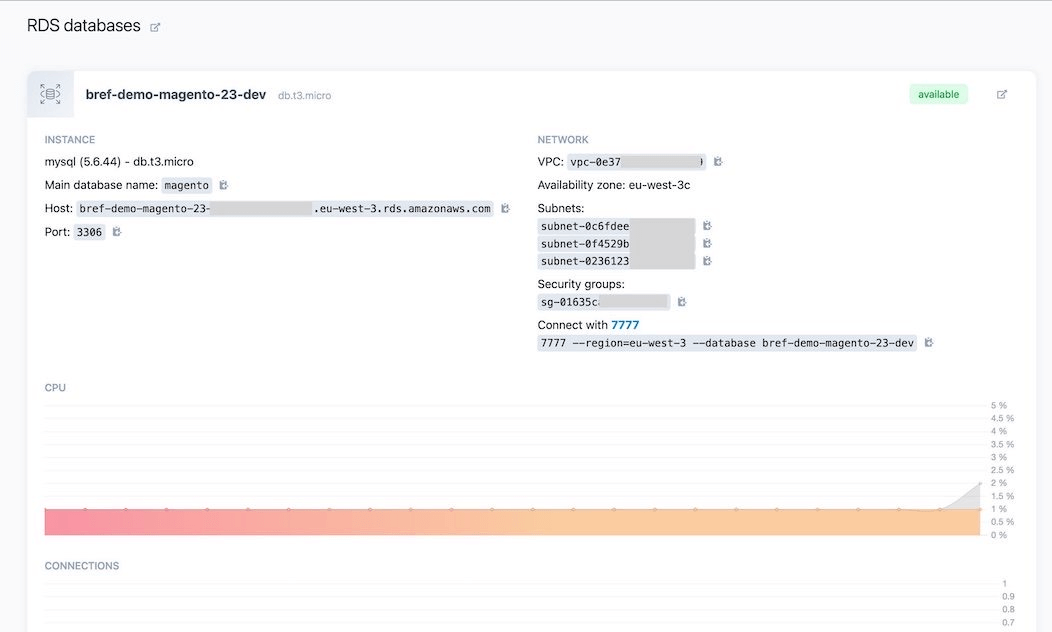
Check the status of RDS databases and quickly copy their configuration settings.
Get a quick glance at their health via average and maximum CPU usage and connection count.
Monitor SQS queues and their messages. Quickly inspect failed messages in dead letter queues.
Clear messages or re-queue them into the main queue in a few clicks.
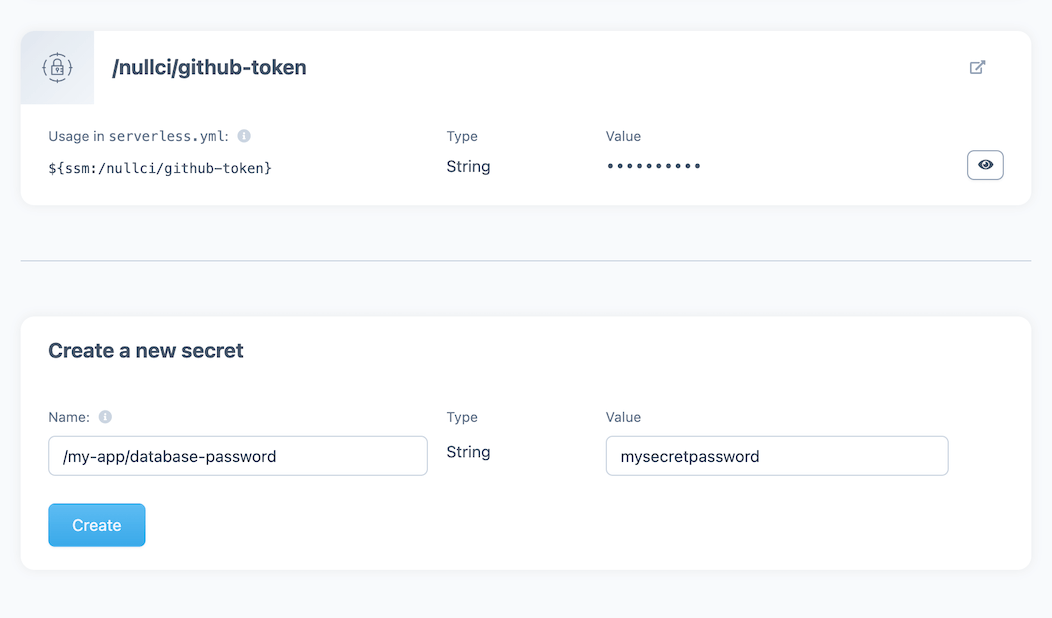
Don’t store passwords and API tokens in plaintext config: use AWS SSM. Create and retrieve SSM secrets in a single screen.
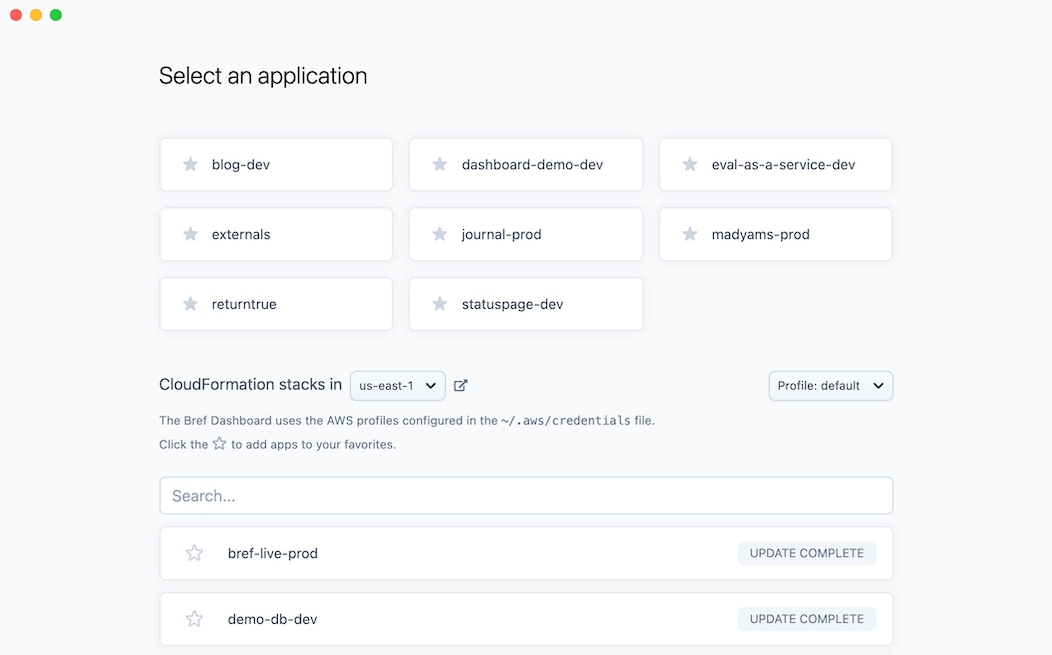
Switch between CloudFormation stacks across AWS regions and profiles, and add some of them to your favorites.
Lost a file? Not sure if the upload worked? Browse S3 buckets and open files with a click.
The Bref Dashboard is not a SaaS: it's an application running on your computer. Here's why:
aws CLI
aws CLI: it automatically uses permissions from the ~/.aws/credentials file.
Read more about Bref Dashboard and AWS permissions in the documentation. The source code of the application is not public, but if your company policy requires an audit, get in touch: hello@bref.sh.
Get started and invite team members at any time.
Are you a solo developer? Get Bref Dashboard at only 90€/year: use the coupon SOLODEV during checkout.
Download and run the application, no setup in AWS is required. 15 days free trial.
DownloadWe've been using Bref on multiple Symfony apps and the Bref Dashboard simplifies a lot the monitoring and management.
More questions? Get in touch: hello@bref.sh.